MSc Computer Science Image Processing Practical No. 2
Index of all Practicals ~ Click Here
A filter function from one of the following filters along with a set of values for the
parameter list is provided. For this filter function derive the an (k x k) filter mask for one of the values of k, k = 3,5,9. The filter mask is to be applied to the given input image and the enhanced image is to be displayed.
(i)Gaussian Low Pass Filter (ii) Butterworth Low Pass Filter
(iii)Ideal High Pass Filter (iv) Ideal Low Pass Filter
Code:- Image_enh_freq_dom.m
% ******** GAUSSIAN LOW PASS FILTER ********
f = imread(‘rice.png’); % Input Image
subplot(2,2,1);
imshow(f);
title(‘Original Image’);
hsize = 12; % No. of rows and columns in H
sigma = 20; % Standard Deviation
H = fspecial(‘gaussian’,hsize,sigma);
g = imfilter(f,H);
subplot(2,2,2);
imshow(g);
title(‘Gaussian Low Pass Filtered Image’);
subplot(2,2,3);
imhist(f);
title(‘Histogram of an Input Image’);
subplot(2,2,4);
imhist(g);
title(‘Histogram of Gaussian Low Pass Filtered Image’);
figure;
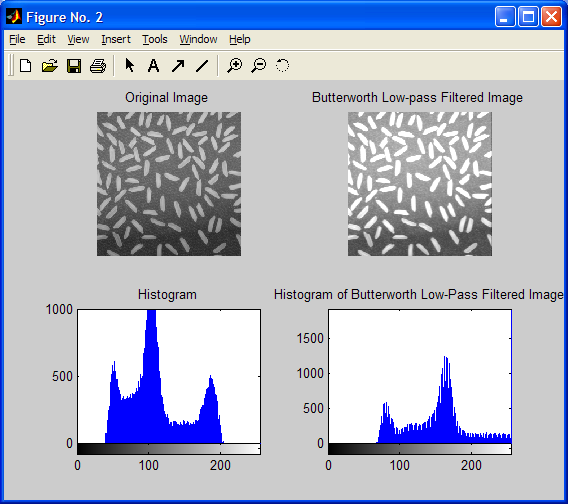
subplot(2,2,1);
imshow(f);
c_freq = 0.6;
title(‘Original Image’);
H = butter(2,c_freq,’low’);
g = imfilter(f,H);
subplot(2,2,2);
imshow(g);
title(‘Butterworth Low-pass Filtered Image’);
subplot(2,2,3);
imhist(f);
title(‘Histogram’);
subplot(2,2,4);
imhist(g);
title(‘Histogram of Butterworth Low-Pass Filtered Image’);
figure;
subplot(2,2,1);
imshow(f);
title(‘Original Image’);
n = 5;
Wn = 0.3;
H = fir1(n,Wn,’High’);
g = imfilter(f,H);
subplot(2,2,2);
imshow(g);
title(‘Ideal High-pass Filtered Image’);
subplot(2,2,3);
imhist(f);
title(‘Histogram’);
subplot(2,2,4);
imhist(g);
title(‘Histogram of Ideal High-Pass Filtered Image’);
figure;
subplot(2,2,1);
imshow(f);
title(‘Original Image’);
n = 28;
Wn = 0.02;
H = fir1(n,Wn,’Low’);
g = imfilter(f,H);
subplot(2,2,2);
imshow(g);
title(‘Ideal Low-pass Filtered Image’);
subplot(2,2,3);
imhist(f);
title(‘Histogram’);
subplot(2,2,4);
imhist(g);
title(‘Histogram of Ideal Low-Pass Filtered Image’);
Output:-


Program Using Formulas:-
Code:- Butterworth_Low.m
a=imread(‘Ranch house.jpg’);
r1=double(a);
c=size(r1);
N=c(1);
D0=input(‘enter cut off : ‘);
n=input(‘enter order :’);
for u=1:1:c(1)
for v= 1:1:c(2);
D=((u-N/2)^2+(v-N/2)^2)^0.5;
H(u,v)=1/(1+(D/D0)^(2*n));
end
end
x=fft2(r1);
v=fftshift(x);
v1=v.*H;
g=(abs(ifft2(v1)));
figure(1);
imshow(uint8(g));
figure(2);
imshow(uint8(r1));
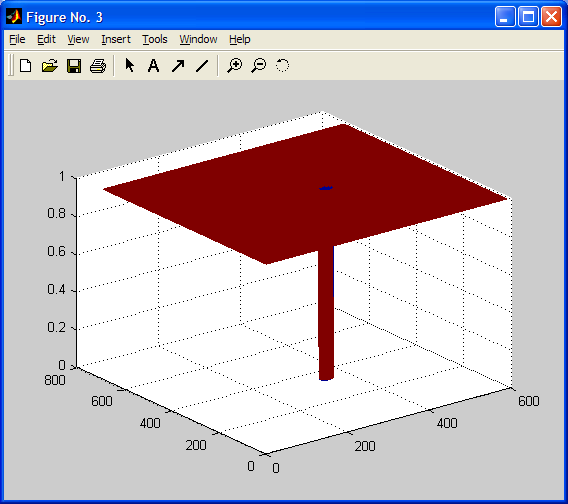
figure(3);
mesh(H);
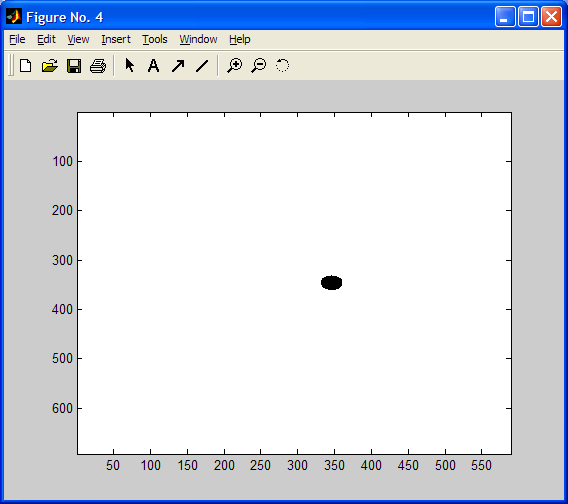
figure(4),imagesc(H),colormap(gray)
Output:-
enter cut off : 15
enter order :10


Code:- Pract2_Low.m
a=imread(‘Ranch house.jpg’);
r1=double(a);
c=size(r1);
N=c(1);
D0=input(‘enter cut off : ‘);
for u=1:1:c(1)
for v= 1:1:c(2);
D=((u-N/2)^2+(v-N/2)^2)^0.5;
if D>D0
H(u,v)=1;
else H(u,v)=0;
end
end
end
x=fft2(r1);
v=fftshift(x);
v1=v.*H;
g=(abs(ifft2(v1)));
figure(1);
imshow(uint8(g));
figure(2);
imshow(uint8(r1));
figure(3);
mesh(H);
figure(4),imagesc(H),colormap(gray)
Output:-
enter cut off : 15